Unit13 Hydrometallurgy (Ⅲ)
Treatment of Leach Solutions—Purification and Concentration
附课13——表格和插图的翻译(二)
插图指地图、示图、照片、图片等说明性材料。其中示图的形式是多种多样的,如线图(line chart),条形图(bar chart)、饼状图(pie chart)、分布图(scatter chart)等。本节所指的插图主要是根据研究数据绘制的示图。
当图和表都可以用时,应尽量使用图而不用表格,因为图的表达更直观,在表现总体趋势、相互关系以及比例方面,比表格好得多。但当数据较少、不足以确定曲线形状时,应选用表格。
1、 饼状图的翻译图13-4是饼状图,表示的是20世纪90年代中国海绵钛的消费情况。对该图的描述如下:
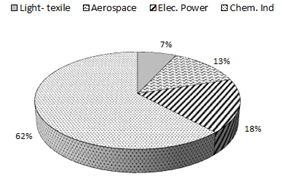
Fig. 13-4 Titanium end-use share in China in the 1990’s As can be seen from the chart (Fig. 13-4), a large
percentage of titanium products were used in chemical industry, accounting for 62%. The titanium
consumption in electric power accounts for 18%. The percentage of titanium consumed by the aerospace
industry was 13. Only 7% titanium products were used in light-textile industry.
描述数字常用的词语如下:
10% a tenth
20% a fifth
22% slightly more than a fifth
25% a quarter
31% slightly less than a third
33% a third
50% half
60% more than half
75% three quarters
95% the vast majority/almost all
100% all
2、 线图的翻译线图是科技文献中比较常用的一种插图形式。如图13-5是最简单的单线图,图中表示的是2006-2010年中国海绵钛产量的变化趋势,对应的数据如表13-1所示。
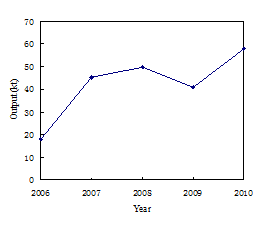
Fig 13-5 The output of titanium sponge in China
Table 13-1 The output of titanium sponge in China
Year |
Output (kiloton) |
2006 |
18 |
2007 |
45.2 |
2008 |
49.6 |
2009 |
40.8 |
2010 |
57.8 |
对表13-1的描述如下:
As can be seen in the table:
There was a sharp rise of 27.2 kilotons between 2006 and 2007.
There was a rise of 4.4 kilotons from 2007 to 2008.
There was a fall of 8.8 kilotons from 2008 to 2009.
There was an increase of 17 kilotons between 2009 and 2010.
上述的数据之间的变化关系,在图13-5中可以清楚地反映出来,因此这种数据用图表示更具有说服力。
描述这类数据常用的词语如下:
1)、 用于描述增长(rise)的词动词: to rise, to increase, to go up
名称:a rise, an increase
2)、 用于描述下降或减少(fall)的词动词:to fall, to decrease, to drop, to decline, to come down
名称:a fall, a decrease, a drop, a decline
3)、用于描述先升,然后降(rise/decrease),或者是没有变化(no change)的词动词:to fluctuate, to vary, to hold steady, to remain stable
名称:a fluctuation, a variation(两词的意思是go up and down)
no change
4)、 描述变化程度的词形容词:dramatic, sharp, gradual, steady, slight
副词:dramatically, sharply, gradually, steadily, slightly